Technique
Technical Proficiency of the 1980 Olympic Champions
English summary of Tyazhelaya Atletika. Ezhegodnik 1982 (Moscow: Fizkultura i Sport, 1982), pp. 27–30: the text is paraphrased, not translated; data tables are given in full with English labels; figures are the original images.
Method
Snatches and cleans of the Moscow 1980 champions (67.5 kg class upwards) were filmed with an Actio-master-500 precision camera (USA) and processed automatically on a NAC Sportias computerised film analyser. The indices used (bar height, phase times, speeds) are defined under Table 1; phases: I — first pull, II — explosion, III — squat under.
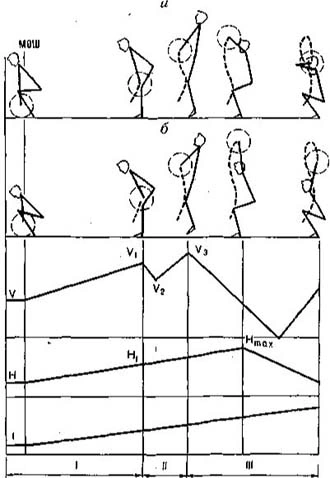
Snatch
- Bar height: 74.5 ± 3% of stature, with no trend across classes; lowest for Vardanyan and Zaremba, highest for Rakhmanov and Zlatev.
- Time to maximum height (0.75–1.19 s) depends on bar speed: Zaremba and Rusev had the shortest times and highest mean pull speeds, Batsako and Taranenko the longest and lowest; Zaremba needed 1.6 times less time than Batsako.
- Pull: Rusev, Zlatev and Vardanyan all pulled in 0.5 s and had the most stable indices, close to the group means. Extremes: Batsako 0.9 s, Zaremba 0.24 s; peak pull speed from 1.77 m/s (Zaremba) to 1.36 m/s (Taranenko).
- Start of the explosion: after 43 ± 6 cm of bar travel (on average 37.5% of stature above the platform), with no trend by class — Batsako at 56 cm (49.5%), the taller Zaremba 20 cm lower (31.8%).
- V3 rises with the lifters' height and weight (Taranenko excepted).
- Excluding Rakhmanov and Zaremba, the ratios V3/V1 (1.23, variation 11.4%) and V3/V2 (1.39, 17.3%) are the most stable and can be recommended as guidelines for all classes.
Ranking. The best technician was taken to be the one lifting with the lowest V1, V3, H and t and the highest V2; ranks 1–7 on each index were summed. Vardanyan and Zaremba shared first (25 points), Rusev and Taranenko second (23), then Zlatev 17, Batsako 14, Rakhmanov 13. The rank correlation of this score with relative snatch result was 0.5: better technique gave a better chance of a high result.
Table 1. Snatch characteristics of the 1980 Olympic champions
| Index | Rusev (67.5 kg) | Zlatev (75 kg) | Vardanyan (82.5 kg) | Batsako (90 kg) | Zaremba (100 kg) | Taranenko (110 kg) | Rakhmanov (+110 kg) | x̄ | σ | V% |
| Dр, kg | 147.5 | 162.5 | 177.5 | 167.5 | 180.5 | 182.5 | 195 | 172.5 | 14.3 | 8.3 |
| P, cm | 165 | 173 | 171 | 171 | 184 | 179 | 188 | 172* | 8.0 | 4.4 |
| h, m | 0.46 | 0.39 | 0.38 | 0.56 | 0.36 | 0.43 | 0.40 | 0.43 | 0.06 | 15 |
| t1, s | 0.50 | 0.50 | 0.50 | 0.90 | 0.24 | 0.60 | 0.52 | 2.5* | 1.82* | 33.7 |
| Vср1, m/s | 0.91 | 0.78 | 2.5* | 0.62 | 1.48 | 0.71 | 0.76 | 0.86 | 0.27 | 31.4 |
| Hр, % | 7.5* | 76.3 | 71.9 | 74.8 | 71.7 | 73.7 | 78.7 | 172.5* | 2.3 | 3.1 |
| t, s | 0.87 | 0.96 | 0.90 | 1.19 | 0.75 | 110* | 1.02 | 0.98 | 0.14 | 8.3 |
| V1, m/s | 1.41 | 1.50 | 1.46 | 1.54 | 1.77 | 1.36 | 1.5 | 1.51 | 0.123 | 8.1 |
| V2, m/s | 1.36 | 1.44 | 1.46 | 1.43 | 1.56 | 1.28 | 1.22 | 1.51* | 0.123* | 7.9 |
| V3, m/s | 1.78 | 1.89 | 1.87 | 1.97 | 1.94 | 1.63 | 2.40 | 1.93 | 0.123* | 10.7 |
| V2/V1* | 1.04 | 1.04 | 1.01 | 1.03 | 1.14 | 1.06 | 1.23 | 1.51* | 0.123* | 6.7 |
| V3/V1 | 1.36 | 1.26 | 1.28 | 1.28 | 1.10 | 1.24 | 1.60 | 1.51* | 0.123* | 11.4 |
| V3/V2 | 1.31 | 1.31 | 1.29 | 1.32 | 1.24 | 132* | 1.97 | 1.51* | 0.123* | 17.3 |
| (V1 + V0)/2* | 1.6 | 1.7 | 1.66 | 1.75 | 1.86 | 1.6 | 1.95 | |||
| Dр — snatch result; P — lifter's height; h — bar height before the explosion; t1 — time to reach h; Vср1 — mean bar speed in the pull; Hр — maximum bar height divided by stature; t — time from lift-off to maximum height; V1 — peak bar speed in the pull; V2 — minimum and V3 — peak bar speed in the explosion; x̄ — mean; σ — standard deviation; V% — coefficient of variation. | ||||||||||
* Kept as printed. Evident damage: Rusev Hр 7.5 and x̄ 172.5 (text: mean 74.5%); Taranenko t “110” (text: 1.14 s) and V3/V2 “132” (1.32); Vardanyan Vср1 2.5 (x̄ 0.86 implies about 0.76); x̄ 2.5 and σ 1.82 for t1 (values average 0.54); x̄ height 172 (values average 175.9; text: 176 cm). The x̄ 1.51 and σ 0.123 of the V1 row recur in the V2 and ratio rows and do not fit their values (text: V3/V1 1.23, V3/V2 1.39). The row headed V2/V1 actually gives V1/V2; “(V1 + V0)/2” is undefined and equals (V1 + V3)/2 for six lifters.
Clean
- Maximum bar height 61 ± 2.2% of stature, with no trend by class; time to reach it 0.94 ± 0.08 s, shortest in Zaremba and Zlatev, who moved the bar fastest.
- Group means: Vср1 0.76, V1 1.28, V2 1.1, V3 1.54 m/s; V3/V1 1.2, V3/V2 1.41. V3 tends to rise with stature.
- V2 falls as bodyweight rises: the heavier champions (Batsako, Zaremba, Taranenko, Rakhmanov) rebend the knees more slowly than the lighter ones, and V3/V2 grows. This ratio reflects explosion power — strong in Batsako and Rakhmanov, weak in Vardanyan, Zaremba and Taranenko — but does not characterise the whole lift.
- In the pull, t1 and Vср1 vary inversely (Zaremba 0.36 s / 0.93 m/s, Batsako 0.58 s / 0.61 m/s), reflecting individual style rather than bodyweight.
- The explosion starts after 37 ± 3 cm of bar travel, 59.5 cm above the platform (34.1% of stature): 3.4% of stature (≈ 6 cm) away from the snatch value, mainly because of grip width. It is unrelated to height (tall Zaremba and Rakhmanov: 56.5 and 59.5 cm; shorter lifters: 53.5–62.5 cm).
Ranking (same method): Vardanyan 26 points, Batsako 23, Zaremba 21, Rusev 20, Zlatev 19, Taranenko 16, Rakhmanov 9. Vardanyan placed 1st–3rd on every index, with values close to the group means.
Table 2. Clean (for the jerk) characteristics of the 1980 Olympic champions
| Index | Rusev (67.5 kg) | Zlatev (75 kg) | Vardanyan (82.5 kg) | Batsako (90 kg) | Zaremba (100 kg) | Taranenko (110 kg) | Rakhmanov (+110 kg) | x̄ | σ | V% |
| Dт, kg | 190 | 200 | 225.5 | 210.5 | 215.5* | 240 | 245 | 218 | 18.6 | 8.5 |
| h, m | 0.40 | 0.44 | 0.31 | 0.36 | 0.34 | 0.40 | 0.37 | 0.37 | 0.03 | 7.8 |
| t1, s | 0.56 | 0.46 | 0.52 | 0.58 | 0.36 | 0.62 | 0.52 | 0.52 | 0.08 | 15.4 |
| Vср1, m/s | 0.71 | 0.95 | 0.60 | 0.611 | 0.93 | 0.65 | 0.70 | 0.76 | 0.123 | 16.2 |
| Hт, % | 61.8 | 60.1 | 59.6 | 57.9 | 58.7 | 62.6 | 64.9 | 61.0 | 2.2 | 3.6 |
| t2, s | 1.97* | 0.84 | 0.88 | 0.99 | 0.82 | 1.01 | 1.04 | 0.94 | 0.08 | 8.5 |
| V1, m/s | 1.28 | 1.33 | 1.3 | 1.21 | 1.33 | 1.23 | 1.31 | 1.28 | 0.05 | 3.5 |
| V2, m/s | 1.19 | 1.2 | 1.21 | 0.99 | 1.14 | 0.97 | 1.03 | 1.1 | 0.09 | 8.7 |
| V3, m/s | 1.48 | 1.56 | 1.47 | 1.52 | 1.55 | 1.44 | 1.76 | 1.54 | 0.09 | 6.3 |
| V1/V2 | 1.08 | 1.11 | 1.07 | 1.22 | 1.17 | 1.27 | 1.27 | 1.17 | 0.08 | 7.2 |
| V3/V1 | 1.16 | 1.177 | 1.13 | 1.26 | 1.17 | 1.17 | 1.34 | 1.2 | 0.07 | 6 |
| V3/V2 | 1.24 | 1.3 | 1.21 | 1.54 | 1.36 | 1.48 | 1.71 | 1.41 | 0.17 | 11.8 |
| Dт — result in the clean and jerk; Hт — maximum bar height in the clean relative to stature; t2 — time to maximum bar height (t in the text); other symbols as in Table 1. | ||||||||||
* Printed “215 5” (decimal comma lost). Rusev's t2 of 1.97 s is implausible beside the other values (0.82–1.04) and the mean of 0.94; kept as printed.